Business Intelligence Solutions
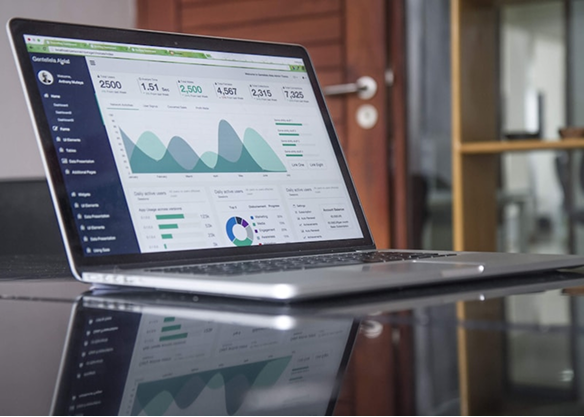
Empower your decision-makers with real-time dashboards, comprehensive reporting, and visual analytics that transform complex data into clear insights.
Interactive Dashboards
Drill-down and filter capabilities
Self-Service Analytics
Empower users to explore data
Visual Analytics
Beautiful, intuitive visualizations
Data Integration
Unify all your data sources
- 500+ Dashboards Deployed
- Microsoft Gold Partner
- ISO 27001 Certified
Get Started Today
Comprehensive BI Services
Transform your data into actionable insights with enterprise-grade business intelligence solutions
Operational Reports
Automate daily, weekly, and monthly reports with scheduled distribution, ensuring stakeholders always have current information.
Interactive Dashboards
Create stunning, interactive dashboards with drill-down capabilities, filters, and cross-visualization interactions for deep data exploration.
Data Modeling
Design efficient data models optimized for reporting performance with proper relationships, hierarchies, and calculated metrics.
Ad-hoc Analysis
Enable business users to create custom reports on-demand using intuitive drag-and-drop interfaces without technical expertise.
Our BI Implementation Process
A proven 5-stage methodology ensuring successful business intelligence deployment
5
5
5
Delivery
User training, documentation, and ongoing optimization support
4
Deployment
Implement BI platform, configure connections, and setup automated reports
3
Design
Create intuitive visualizations, report templates, and data models
2
Discuss
Define dashboard layouts, data sources, refresh frequencies, and access controls
1
Discover
Identify key business metrics, reporting needs, and stakeholder requirements
Why Choose Zylo for Business Intelligence?
Partner with certified BI experts who deliver insights that drive business success
Industry Expertise
Extensive experience with Power BI, Tableau, and enterprise BI platforms
Dedicated Team
Certified BI developers and visualization experts
Proven Results
Delivered 500+ dashboards across diverse industries
Data Security
Row-level security and enterprise-grade access controls
24/7 Support
Continuous monitoring and rapid issue resolution
Scalable Solutions
BI platforms that grow with your organization
Our Technical Partners


Our BI Products & Platforms
Enterprise-grade business intelligence tools and platforms we specialize in
Microsoft Power BI
Interactive data visualization tool with AI-powered insights, natural language querying, and seamless Microsoft ecosystem integration for comprehensive business reporting.
Microsoft Fabric
All-in-one analytics platform combining data engineering, data science, real-time analytics, and business intelligence in a unified SaaS environment.
Tableau
Leading visual analytics platform enabling users to create interactive, shareable dashboards with drag-and-drop simplicity and powerful data discovery capabilities.
Mozark
Advanced analytics and BI solution offering collaborative data modeling, custom visualizations, and enterprise-grade reporting for data-driven organizations.
Azure Synapse Analytics
Enterprise data warehouse service integrating big data and data warehousing with seamless query capabilities across data lakes and warehouses.
Snowflake
Cloud data warehouse platform offering elastic scalability, instant data sharing, and support for multiple cloud providers with near-zero maintenance.
Amazon Redshift
Fast, fully managed data warehouse making it cost-effective to analyze large datasets using existing SQL skills and business intelligence tools.
Azure Data Factory
Cloud-based data integration service for orchestrating and automating data movement and transformation across hybrid environments.
Informatica
Enterprise data integration platform providing comprehensive ETL, data quality, and master data management capabilities.
Talend
Open-source data integration tool offering data transformation, migration, and quality features for building robust data pipelines.
Industries That Benefit from BI
Delivering industry-specific dashboards and reports that drive operational excellence
Retail & E-commerce BI Benefits
- Real-time sales performance tracking across channels
- Inventory optimization and stock level monitoring
- Store performance comparison and benchmarking
- Customer behavior analytics and shopping patterns
- Campaign effectiveness and marketing ROI analysis
Financial Services BI Benefits
- Regulatory reporting and compliance dashboards
- Customer profitability analysis
- Branch and agent performance tracking
- Portfolio performance and risk analytics
- Transaction monitoring and fraud detection
Healthcare BI Benefits
- Patient satisfaction and outcome metrics
- Revenue cycle management dashboards
- Provider performance and clinical analytics
- Operational efficiency and resource utilization
- Quality measures and compliance tracking
Manufacturing BI Benefits
- Production efficiency and OEE tracking
- Supply chain visibility and supplier performance
- Cost analysis and profitability by product line
- Quality control and defect analysis
- Equipment utilization and downtime monitoring
Logistics & Supply Chain BI Benefits
- Delivery performance and on-time metrics
- Warehouse operations and inventory turnover
- Cost per mile and profitability analysis
- Fleet utilization and route optimization
- Carrier performance comparison
Education BI Benefits
- Student performance and enrollment trends
- Resource allocation and budget tracking
- Faculty performance and research analytics
- Course effectiveness and completion rates
- Alumni engagement and fundraising metrics
BI Challenges? We've Solved Them
We understand that reporting can be frustrating, time-consuming, and inconsistent. That’s why we’ve built BI solutions that turn reporting chaos into clarity and empower data-driven decisions.
Organizations drowning in scattered Excel files, inconsistent reports, and version control nightmares. We consolidate all reporting into centralized BI platforms with single source of truth, automated data refresh, and version-controlled dashboards. Our solutions eliminate manual report generation, reduce errors from copy-paste operations, and provide real-time access to accurate data. Everyone works from the same dashboards with consistent metrics, eliminating confusion and conflicting numbers.
Businesses relying on month-old reports when decisions need real-time information. We deploy live dashboards that refresh automatically – hourly, daily, or in real-time based on your needs. Automated alerts notify stakeholders when metrics cross thresholds, enabling proactive management. Our solutions connect directly to operational systems, ensuring decision-makers always have current information without waiting for monthly report cycles.
Complex data buried in dense tables and confusing charts that obscure insights rather than reveal them. We design intuitive visualizations using data visualization best practices – choosing the right chart types, applying effective color schemes, and creating clear hierarchies. Our dashboards tell data stories at a glance, using interactive elements that allow users to drill down for details. We transform overwhelming spreadsheets into compelling visual narratives.
Executives and field teams unable to access critical business metrics on mobile devices. We create responsive BI solutions optimized for smartphones and tablets, providing full dashboard functionality on-the-go. Mobile-first designs ensure key metrics are visible without scrolling, with touch-friendly interactions and offline capabilities. Leaders can monitor KPIs, receive alerts, and make informed decisions from anywhere.
Different teams using different definitions for the same metrics, creating confusion and mistrust in data. We establish comprehensive data governance frameworks with certified data sources, standardized calculations, and clear metric definitions. We create data dictionaries, implement row-level security, maintain audit trails, and setup approval workflows. Everyone uses the same trusted metrics with confidence in data accuracy and security.
Ready to Transform Your Reporting?
Let's create dashboards that empower your team to make better decisions faster
Schedule a DemoView Sample DashboardsFrequently Asked Questions
Business Intelligence focuses on descriptive analytics – reporting on what happened and what is happening now through dashboards, scorecards, and operational reports. Data Analytics goes deeper with diagnostic, predictive, and prescriptive analytics – exploring why things happened and what will happen next. BI is typically more structured with standardized reports, while analytics involves ad-hoc exploration and statistical modeling. Both complement each other in a comprehensive data strategy.
Basic dashboard implementations with existing data sources can be completed in 4-6 weeks. Standard BI projects with data warehouse development typically take 2-4 months. Enterprise-wide implementations with multiple departments, complex integrations, and extensive training may require 4-6 months. We use agile methodologies to deliver initial dashboards quickly, then iterate based on feedback while building out the complete solution.
Tool selection depends on your ecosystem, skills, budget, and requirements. Power BI excels for Microsoft-centric organizations with excellent Office 365 integration and competitive pricing. Tableau offers superior visualization capabilities and ease of use. Qlik provides powerful associative analytics. We assess your specific needs – existing infrastructure, technical capabilities, budget constraints, and feature requirements – to recommend the optimal platform for your situation.
Yes, self-service BI is a core benefit of modern platforms. We implement governed self-service where business users can create reports and dashboards using pre-certified data sources and models. Users get drag-and-drop tools for building visualizations without SQL knowledge. We provide training on self-service capabilities and establish governance guardrails to ensure data quality and security while empowering users to explore data independently.
Performance optimization is critical for user adoption. We implement data modeling best practices, use aggregations and calculated tables, optimize DAX/calculated fields, and leverage incremental refresh strategies. We design efficient data warehouses with proper indexing, partitioning, and compression. We conduct performance testing under realistic load conditions and establish monitoring to track query performance. Our goal is sub-second dashboard load times even with millions of records.
Security is paramount in BI implementations. We implement row-level security (RLS) ensuring users only see data they are authorized to view. Role-based access controls (RBAC) manage who can create, edit, and publish content. We configure Single Sign-On (SSO) for seamless authentication, enable audit logging for compliance, and implement data encryption both at rest and in transit. All security configurations align with your organizational policies and regulatory requirements.
Comprehensive training is essential for BI success. We provide role-based training: executive summaries for leadership, consumer training for report viewers, author training for report creators, and administrator training for IT staff. Training includes hands-on workshops, video tutorials, documentation, and quick reference guides. We establish super-user programs to create internal champions. Post-training support includes office hours and ongoing coaching to ensure teams feel confident using the BI platform.
We offer comprehensive post-implementation support including 24/7 helpdesk for critical issues, monthly health checks and performance optimization, content refresh and updates as business needs evolve, user adoption monitoring and enhancement recommendations, and proactive monitoring with automated alerts. Support tiers range from basic troubleshooting to fully managed BI services where we handle all maintenance, updates, and enhancements allowing your team to focus on using insights rather than managing infrastructure.
Still Have Questions?
Our analytics experts are here to help. Contact us for a personalized consultation.
Explore Our Other Services
Comprehensive solutions to meet all your technology needs