
Every day you make dozens of decisions. Pricing. Hiring. Inventory. Marketing spend. Most business owners make these calls on experience and instinct, and most of the time, they get it partially right. But partially right has a cost.
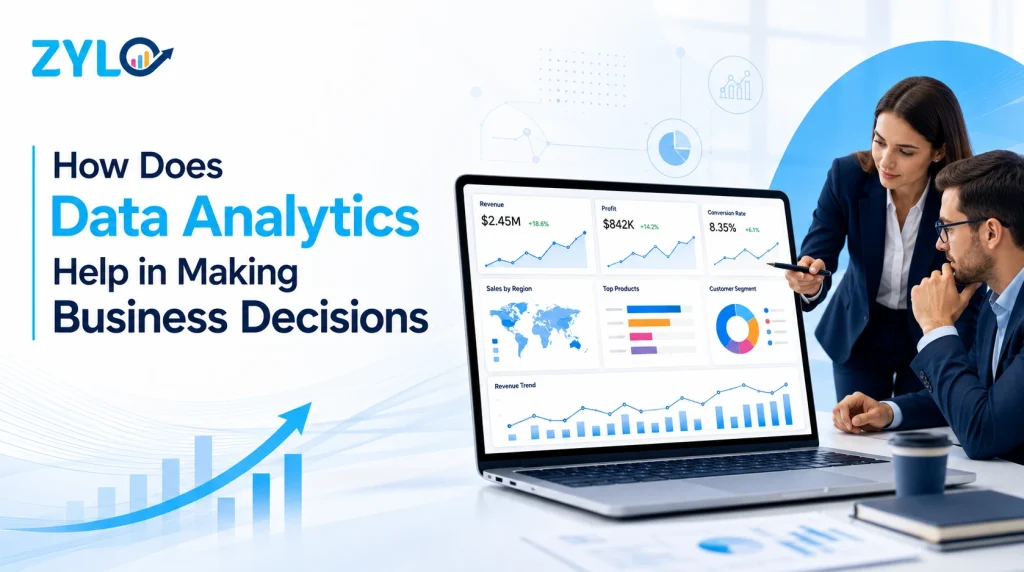
Data analytics closes that gap. It turns the raw, scattered information already sitting inside your business into a clear signal; something you can act on with confidence. In fact, companies using data-analytics-driven decision-making are five times more likely to make decisions faster and three times more likely to improve their ROI. Yet many businesses are still operating on gut instinct, spreadsheets, and delayed reports.
In this article, we will break down exactly “how does data analytics help in making business decisions”, what it means in practice, and why companies that embrace it consistently outperform those that don’t. Let’s get started:
What Is Data Analytics Driven Decision Making?
Data analytics driven decision making means using actual data to guide your business choices. It combines data collection, data management, and structured analysis to extract meaningful insights from large volumes of information. Those insights then inform everything from pricing and staffing to supply chain management and customer retention.
The approach works at every level. Descriptive analytics tells you what happened. Diagnostic analytics explains why it happened. Predictive analytics forecasts what is likely to happen next. Prescriptive analytics recommends what you should do about it. Together, these four layers give decision-makers a 360-degree view that no spreadsheet or quarterly report can replicate.
Crucially, data-driven decision making replaces bias with objectivity. When decisions are grounded in verified data, they become more accurate, more repeatable, and easier to evaluate over time. That is how you build a business that genuinely learns from itself and improves continuously.
How Does Data Analytics Help in Making Business Decisions?
Having data is not the same as using it. Most organizations are drowning in it: ERP systems, spreadsheets, CRMs, disconnected tools, all holding insights nobody is reading. A proper data analytics solution pulls that buried intelligence to the surface and converts it into something actionable. If you are wondering “how does data analytics help in making business decisions”, here is your answer:
1. Faster, More Confident Decision Making
Speed is a competitive advantage. Data analytics accelerates decision making by up to five times. When your leadership team can pull a live report instead of waiting three days for a manual analysis, they respond to opportunities and threats while they are still relevant. A well-configured BI dashboard eliminates the lag between “something happened” and “we know about it.” Faster awareness means faster action. In competitive markets, that window matters enormously.
2. Accurate Sales Forecasting
Guessing next quarter’s revenue is a gamble. Forecasting it with historical patterns, seasonality trends, and predictive models is a strategy. Real-time sales analytics can analyze years of transaction data and surface a reliable projection, including which products will underperform, which regions are heating up, and when to ramp up inventory. This directly improves decisions in procurement, staffing, and financial planning. You stop reacting to surprises and start preparing for them in advance.
3. Customer Behavior Intelligence
Your customers are telling you what they want. You just need to listen to the data. Purchase patterns reveal intent. Drop-off points expose friction. Churn signals flag dissatisfaction before it’s too late. When you map all of it together, assumptions become obsolete. You market to behavior, not beliefs, and the returns show up in targeting precision, retention rates, and lifetime value.
4. Operational Efficiency and Cost Control
Inefficiency hides in every organization. Data analytics surfaces it. By analyzing workflows, resource utilization, and output metrics, businesses consistently identify where time and money are being lost. Companies using analytics to manage operations report productivity improvements of up to 63%. That is real margin recovery from decisions that would never have been made without the data pointing the way first.
5. Risk Identification and Mitigation
Every business carries risk. Financial, operational, and market-related. Big data analytics and predictive modeling allow businesses to identify risks before they materialize. Whether it is a supply chain disruption, a cash flow shortfall, or a customer churn spike, analytics models monitoring historical patterns can flag early warning signals. Proactive risk management is only possible when your decisions are data-informed. Reactive crisis response is what happens without it.
6. Smarter Resource Allocation
Where should your next investment go? Which team needs more headcount? Which product line deserves more budget? These are expensive questions to get wrong. Data analytics supports resource allocation with evidence, comparing output, cost-per-unit, and growth trajectory across departments and initiatives. You stop funding assumptions and start funding what the numbers confirm is working. That shift alone produces measurable ROI within months.
7. Market Trend Detection
Markets shift faster than intuition can keep up with. Analytics tools continuously scan internal and external data streams to identify emerging trends in customer demand, competitor behavior, and macro conditions. Companies that monitor trend data make earlier, better-timed strategic moves: new product launches, market entry decisions, pricing adjustments. Those without that visibility react late and pay a premium for it. The advantage compounds over time.
8. Unified Business Visibility
One of the most underrated benefits of a proper analytics infrastructure, especially when paired with ERP implementation, is unified visibility across the entire organization. When your finance, sales, HR, supply chain, and marketing data all feed into one platform, leadership sees the full picture. There is no longer the “the numbers do not match” problem between departments. Everyone works from one source of truth. Decisions become aligned, and execution accelerates as a direct result.
9. Performance Measurement and KPI Tracking
You cannot manage what you cannot measure. Data analytics gives businesses a structured framework for setting KPIs, tracking performance against them, and adjusting course when targets drift. This transforms accountability from a quarterly conversation into an ongoing discipline. Leaders know, week by week, whether the strategy is working or not.
10. Long-Term Competitive Differentiation
At the strategic level, Business Intelligence is a long-term moat. Companies that build robust data cultures, where decisions at every level are grounded in analytics, systematically outcompete those operating on instinct. The global data analytics market is projected to reach $132.9 billion by 2026, growing at a CAGR of 30%. The organizations investing in analytics infrastructure now are building decision-making capabilities that their competitors will not be able to replicate quickly.
Key Hurdles in Making Decisions Using Data Analytics
Data analytics is powerful. But it is not plug-and-play. Businesses that jump in without understanding the common failure points end up frustrated, with tools they paid for and insights they cannot use. These are the five most significant hurdles:
1. Poor Data Quality Undermining Every Insight
Garbage in, garbage out. This is the most fundamental challenge in analytics. If your underlying data is inaccurate, incomplete, or inconsistent, every decision built on it is compromised. Gartner estimates poor data quality costs businesses an average of $12.9 million per year. Before any analytics tool delivers real value, the data feeding it must be clean, validated, and properly governed. Professional data consultancy is essential to ensuring a solid foundation that makes all other business operations work effectively.
2. Data Silos Blocking the Full Picture
Most organizations have data scattered across multiple systems. A CRM here, a finance tool there, inventory spreadsheets sitting in someone’s inbox. When those systems do not communicate, analytics only ever sees a partial picture. Decisions made on partial data are only marginally better than decisions made on no data at all. Breaking down silos through ERP integration, data pipelines, and centralized platforms is a prerequisite for analytics that actually informs strategy. Research shows that only about half of business users are satisfied with their access to data across their organization.
3. Low Data Literacy Across the Organization
Analytics tools surface insights. But humans still have to interpret and act on them. If the leadership and management teams lack the skills to read and interrogate data correctly, insights stay in the dashboard and never reach the decision. IBM identifies data illiteracy as a critical organizational challenge, noting that employees lacking the skills to use data effectively directly reduce the ROI of analytics investment. Training, culture change, and intuitive tooling all play a role in closing this gap.
4. Organizational Resistance to Change
Introducing data analytics into a business that has operated on intuition for years is as much a cultural challenge as a technical one. Managers who have made decisions their way for a long time often resist having those decisions questioned by a dashboard. This is a human reaction. But it means that successful analytics adoption requires visible leadership commitment, clear communication of why the change matters, and early wins that build genuine trust in the data. Without that organizational buy-in, even the best tools underperform.
5. Over-Reliance on Quantitative Data Alone
Data can tell you what happened and roughly why. It cannot always tell you the full story. Customer sentiment, cultural dynamics, and relationship context are real drivers of business outcomes, and they are often not captured in structured datasets. The risk is that businesses become over-reliant on quantitative signals and make decisions that are technically data-supported but contextually wrong. The best data-driven organizations combine analytical rigor with human judgment. Analytics is a decision support system, not a replacement for experienced leadership.
Final Thoughts
The cost of inaction is real. Every quarter without proper analytics is a quarter where decisions were slower, riskier, and less accurate than they needed to be. Your competitors who have invested in business intelligence and real-time analytics are not waiting for the right moment. They are already ahead. Now you know “how does data analytics help in making business decisions”, it’s time to take action. You do not need a massive budget or a full technology overhaul to start. The right partner designs a data analytics solution that fits where you are now and scales with where you are going. Talk to our data analytics experts at Zylo today. We will show you exactly where to start and what it is worth.
FAQs About Data Analytics Driven Decision Making
What is the difference between Business Intelligence and advanced data analytics?
Business Intelligence focuses on describing and monitoring what has already happened through dashboards, reports, and KPI tracking. Advanced data analytics goes further, applying predictive and prescriptive methods to forecast future outcomes and recommend specific actions. Most organizations need both.
How long does it take to see results from a data analytics implementation?
It depends on your starting point. If your data is already relatively organized, you can begin seeing actionable insights from a BI dashboard within weeks of deployment. If data is siloed or unstructured, which is very common, a data consultancy phase is required first to clean and govern the data properly. Most businesses see measurable ROI within three to six months of a well-structured, phased implementation.
Does a business need an ERP system before implementing analytics tools?
Not strictly, but it helps significantly. An ERP centralizes your operational data, covering finance, sales, HR, and supply chain, into one platform. This makes it far easier for analytics tools to draw complete, accurate insights. Without an ERP, analytics often work on fragmented data sources, which limits accuracy.
What types of businesses benefit most from big data analytics?
Organizations with high transaction volumes, large customer bases, or complex operations benefit most, particularly in Telco, Fintech, Banking, Retail, and Logistics. These industries generate enormous volumes of data that standard BI tools cannot process efficiently.
Can small and mid-sized businesses realistically afford a data analytics solution?
Yes. The entry point has dropped considerably over the past few years. Tools like Microsoft Power BI offer enterprise-grade reporting capabilities at genuinely accessible price points. The key is finding a provider who designs the solution around your budget rather than selling you features you do not yet need. A phased approach, starting with core Business Intelligence and expanding over time, makes analytics accessible at almost any scale.
What is prescriptive analytics, and how is it different from predictive analytics?
Predictive analytics forecasts what is likely to happen based on historical patterns, for example, projecting next quarter’s sales trend. Prescriptive analytics takes it one step further and recommends specific actions you should take based on those predictions.
How does real-time sales analytics differ from standard monthly reporting?
Standard monthly reporting is retrospective. It tells you what happened over the past 30 days, usually with a delay in compilation. Real-time sales analytics deliver live data with minimal latency, so leadership can see exactly what is happening in real time and respond immediately.