
Every business owner makes important decisions every week. Hiring. Pricing. Inventory. Sales targets. Marketing spend. New locations. Technology investments.
Many of those decisions are still based on experience, assumptions, or what worked last year. That approach can work in a stable market. It becomes risky when customer expectations, supply chains, costs, and competitors change quickly.
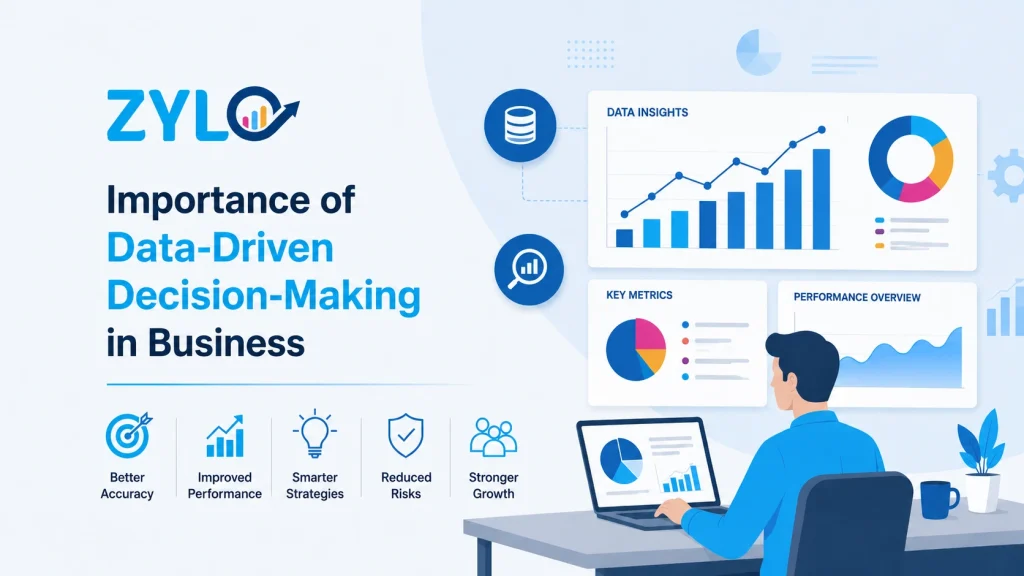
The importance of data-driven decision-making lies in its ability to replace uncertainty with evidence. You collect relevant information, identify patterns, test assumptions, and act with greater confidence. The result can be stronger growth, lower operating costs, improved customer retention, and better use of capital.
In this article, you will discover what data-driven decision making is, why it matters, key challenges, and real-world examples of its application. Let’s begin:
What Is Data-Driven Decision-Making?
Data-driven decision-making, often called DDDM, is the practice of using facts, metrics, analysis, and business intelligence to guide choices. Instead of relying only on opinions or instinct, teams use verified data to understand a problem and choose a practical action.
A simple example is pricing. A business owner may believe a price increase will hurt sales. A data-driven approach checks historical sales, customer segments, competitor pricing, product margins, and purchase frequency before deciding. The final decision may still be to avoid an increase. The difference is that the decision is supported by evidence.
Data-driven decision-making applies to strategic and operational choices. It can help you decide whether to enter a new market, hire additional staff, invest in new equipment, improve a marketing campaign, or reorder inventory.
Traditional reporting tells you what happened. Data-driven decision-making goes further. It helps you understand why it happened and what you should do next.
The foundation rests on three areas:
- Reliable data: Data must be complete, accurate, current, and accessible.
- Analytical capability: Your business needs people, processes, and tools that can turn raw information into useful insight.
- A data-oriented culture: Leaders and teams must be willing to question assumptions, review evidence, and learn from results.
The Importance of Data-Driven Decision-Making
The importance of data-driven decision-making becomes clear when you look at its impact on revenue, efficiency, risk, customer experience, and long-term competitiveness.
Businesses generate data every day. Sales transactions. Customer calls. Website visits. Inventory movements. Employee records. Production activity. Supplier performance. Financial reports. The challenge is not a lack of information. The challenge is turning scattered data into decisions that move the business forward.
■ Better Revenue Decisions
Revenue growth starts with understanding customers. You need to know who buys, what they buy, why they buy, how often they return, and where they leave the buying journey.
Data helps you identify your most valuable customer segments. It also shows which products have the strongest margins, which campaigns generate quality leads, and which sales channels perform best.
For example, real-time sales analytics can show which product categories are growing today, not only what sold last month. As a result, sales leaders can act faster and make better decisions. They can redirect attention toward high-performing regions, improve follow-up on promising leads, or adjust promotions before the opportunity passes.
■ Lower Operating Costs
Costs often increase quietly. Excess stock builds up. Manual reporting consumes employee time. Purchase approvals slow down. Teams duplicate work because systems are disconnected.
A data analytics enabled decision-making solution can reveal these inefficiencies. It can show slow-moving inventory, repeated purchasing patterns, high-cost suppliers, underused resources, and operational bottlenecks.
Manufacturers often use operational data to monitor equipment performance. A machine may show early signs of failure before it breaks down. Maintenance teams can then schedule repairs at the right time. This reduces unplanned downtime, protects production schedules, and avoids emergency costs.
Retailers can use sales and inventory data to manage replenishment. Instead of over-ordering based on a general forecast, they can replenish based on location, season, demand trends, and current stock levels. This helps reduce holding costs and stockouts.
■ Faster Business Decisions
The Importance of Data-Driven Decision-Making is especially visible when timing matters. A decision made after the opportunity has gone is often no better than no decision at all. A key tool for taking data-driven, timely decisions is a BI dashboard. It gives managers a current view of performance. It can display daily sales, cash flow, inventory levels, order fulfillment, customer acquisition cost, and team productivity in one place. Instead of waiting for an end-of-month spreadsheet, leaders can identify issues while they are still manageable.
This does not mean every business should react to every small movement. It means leadership can focus on meaningful changes. When a KPI moves outside an acceptable range, the team can investigate quickly.
The result is a business that becomes more responsive. It sees problems sooner. It sees opportunities earlier. It acts with more confidence.
■ Stronger Risk Management
Risk is part of business. The goal is not to remove all risk. The goal is to recognize risk early and manage it intelligently.
Data-driven decision-making supports this through early warning systems. A drop in repeat purchase rate may signal customer dissatisfaction. A rise in supplier delays may indicate a future stock problem. A sudden increase in returns may point to a product quality issue.
For business owners, the lesson is simple. You do not need to wait for a crisis to start investigating. The right metrics can show early signals before they become expensive problems.
■ Improved Customer Experience
Customers expect relevance, speed, and consistency. They expect businesses to remember their preferences, solve problems quickly, and provide a smooth experience across channels.
Customer data helps businesses understand where service breaks down. It may show that support tickets rise after a specific product update. It may reveal that customers abandon checkout on mobile devices. It may show that delivery delays are concentrated in a particular region.
Customer experience is a business performance issue. Better experiences improve retention, word-of-mouth referrals, and customer lifetime value.
■ Better Resource Allocation
Business owners have limited resources. Capital. Time. People. Attention. Every investment needs a clear reason.
Data-driven decision-making helps you allocate resources where they can create the most value. You can compare marketing channels by return on investment. You can evaluate branch performance. You can identify products that consume resources but generate weak margins. You can assess whether a new hire, new machine, or new system is likely to support growth.
This matters most when budgets are tight. Data helps you prioritize. It does not guarantee perfect outcomes, but it reduces the chance of making costly decisions based on assumptions alone.
■ Improved Accountability
When decisions are supported by clear metrics, accountability improves. Teams understand what success looks like. Leaders can measure progress. Problems become easier to diagnose.
For example, if a sales target is missed, the business can look beyond the final number. Was the lead volume low? Was the conversion weak? Did deals stall at a specific stage? Did one region underperform? Did the pricing change affect demand?
This creates a stronger learning culture. Instead of assigning blame, teams investigate causes. They test changes. They measure the result. Then they improve again.
Why Traditional Decision-Making Can Fall Short
Traditional decision-making depends heavily on experience, hierarchy, and intuition. These have value. An experienced business owner can recognize patterns that are not visible in a spreadsheet. Human judgment is essential in areas involving ethics, relationships, and long-term strategy. The problem begins when intuition becomes the only source of truth.
■ Cognitive Biases
Everyone has biases. Confirmation bias can lead leaders to search for evidence that supports an existing belief. Anchoring bias can cause the first number mentioned in a meeting to influence every decision that follows. Sunk cost bias can keep businesses investing in a failing initiative because they have already spent too much.
Data does not remove bias automatically. Poor analysis can still support a weak conclusion. But a structured process makes assumptions visible. It gives teams an opportunity to challenge the evidence before committing resources.
■ Delayed Information
Traditional reporting often moves slowly. Teams collect information manually. Managers consolidate spreadsheets. Senior leaders receive summaries weeks later.
By then, the data may no longer represent current conditions.
A real-time BI dashboard improves visibility. It brings relevant information into one place. Leaders can review performance daily, weekly, or whenever needed. The business becomes more agile without becoming reactive.
■ Fragmented Business Data
Many companies have information spread across Excel files, email threads, paper documents, separate software systems, and personal devices. Sales data lives in one place. Finance data lives elsewhere. Inventory data sits in a third system.
This creates confusion. Teams may use different numbers in the same meeting. Reporting becomes slow. Trust in the data falls.
A central ERP platform and a well-designed data architecture can solve much of this problem. When data flows from core systems into Business Intelligence tools, teams work from a more consistent version of the truth.
■ Limited Ability to Handle Complexity
Modern businesses deal with more information than any individual can process. Customer interactions, transactions, operational logs, website activity, supplier records, and market signals create large volumes of data.
Traditional methods struggle when data becomes too large or too complex. Big data analytics helps businesses process and analyze large, varied datasets. It can uncover trends, relationships, and exceptions that would be difficult to spot manually.
■ Reactive Management
A traditional approach often starts after a problem becomes visible. Sales fall. Inventory runs out. Customers complain. A supplier misses a delivery.
Data-driven businesses work to identify earlier indicators. They monitor sales pipeline quality, website conversion, customer satisfaction, supplier performance, and inventory movement. They can then respond before the issue becomes a major business problem.
Data-Driven Decision-Making Across Business Functions
Data-driven decision-making works best when it becomes part of daily operations. It is not only for the IT department. It supports every major function in the business.
■ Marketing and Customer Acquisition
Marketing teams use data to understand campaign performance, audience behavior, channel effectiveness, and conversion rates. They can compare paid advertising, SEO, email, social media, referrals, and events based on actual outcomes.
A business can use data to answer practical questions:
- Which channels generate leads that actually convert?
- Which campaigns bring repeat customers?
- What content attracts high-intent visitors?
- Which audiences respond to a particular offer?
- Where does the customer journey lose momentum?
This improves spending discipline. Marketing becomes less about guesswork and more about measurable learning.
■ Sales and Revenue Operations
Sales teams produce valuable data every day. CRM records show leads, meetings, proposals, pipeline stages, objections, lost deals, and forecast values.
Real-time sales analytics turns that data into action. Sales managers can identify deals that have stalled. They can see which representatives need support. They can find high-potential opportunities that require immediate follow-up.
A strong sales dashboard may include:
- Pipeline value by stage
- Lead response time
- Win rate by product or segment
- Revenue by territory
- Sales cycle length
- Forecast versus actual revenue
- Top reasons for lost deals
These insights help leaders improve sales execution before the quarter ends.
■ Finance and Strategic Planning
Finance has always relied on data, but modern analytics makes financial planning more connected to operations.
Instead of only reviewing past financial statements, finance teams can build rolling forecasts. They can connect revenue forecasts to hiring plans, marketing budgets, inventory needs, and cash flow requirements.
Scenario planning also becomes stronger. Leaders can evaluate what happens if demand grows by 10 percent, if a major supplier raises prices, or if customer payment cycles become slower. This supports better planning in uncertain markets.
■ Supply Chain and Operations
Supply chain data is critical for businesses that buy, make, move, or sell physical products. It can reveal demand patterns, supplier reliability, inventory levels, order fulfillment speed, and production efficiency.
An Odoo ERP implementation can connect sales, purchasing, inventory, manufacturing, accounting, and customer operations on a common platform. This creates a stronger data foundation.
Once the ERP data is organized, a BI dashboard can provide a clear view of order fulfillment rate, inventory turnover, backorders, supplier delivery performance, and production lead time. Teams can make informed changes instead of relying on disconnected spreadsheets.
■ Human Resources and Workforce Planning
Utilizing data, HR teams can analyze hiring patterns, turnover, employee engagement, training effectiveness, absenteeism, and workforce capacity.
For example, workforce planning can help a business estimate when it will need additional employees. It can identify skill gaps before they affect delivery. It can show whether training programs are improving performance.
Data should be used carefully in HR. Employee privacy, fairness, and context matter. But when used responsibly, people analytics can help leaders build stronger teams.
■ Product and Service Development
Customer feedback, usage data, support tickets, return reasons, and product adoption metrics can guide product development.
Businesses can identify which features customers use most. They can see where users struggle. They can test changes with a smaller group before a full launch.
This reduces the risk of investing in features or services that customers do not value. It also helps businesses improve faster because feedback reaches decision-makers in a structured way.
Key Challenges and Limitations of DDDM
While the importance of data-driven decision-making is undeniable, businesses must build the right foundations before expecting reliable results. Businesses need to address several challenges to make it work.
■ Data Quality Problems
Incomplete, duplicate, inconsistent, or outdated data creates bad analysis. If sales teams use different naming conventions or inventory systems are not updated, dashboards can show misleading results.
Data governance matters. Someone must own the data. Rules must define how it is collected, updated, secured, and used.
■ Data Silos
Data silos happen when departments keep information in separate tools or files. This makes it difficult to understand the full business picture.
A connected ERP, data warehouse, or modern analytics platform can reduce silos. The goal is not to put every piece of information into one spreadsheet. The goal is to create controlled access to reliable, connected data.
■ Lack of Skills
Not every business needs a large data science team. But every business needs enough capability to understand reports, ask good questions, and act on insights.
Training matters. Business users should understand core metrics. Managers should know how to interpret dashboards. Analysts should understand the business context behind the numbers.
A data consultancy can help develop the roadmap, build internal confidence, and guide teams through early projects.
■ Technology Complexity
Modern data platforms can become complicated. Data sources, pipelines, cloud platforms, BI tools, security controls, and AI models all require planning.
The answer is not to buy every tool. Start with the business needs. Build a scalable architecture that fits your current operation and future growth plans.
■ Privacy, Security, and Ethics
Data can include sensitive information about customers, employees, finances, and operations. Businesses must protect this information.
Security should be built into the data strategy from the beginning. Access controls, encryption, backup, monitoring, compliance, and incident response all matter. Ethical use matters too. Data should support fair, transparent, and responsible decisions.
■ Analysis Paralysis
More data can sometimes create confusion. Teams may spend too long reviewing reports without taking action.
Avoid this by defining the decision first. Use a focused set of KPIs. Set deadlines for analysis. Distinguish between decisions that are easy to reverse and decisions that require deeper evaluation.
Data should support action, not delay it.
Real-World Examples of Data-Driven Decision-Making
Real businesses use data-driven decision-making in different ways. The examples below show how analytics can support customer experience, supply chains, workforce performance, and growth.
■ Netflix: Personalization at Scale
Netflix uses viewing behavior, search activity, ratings, device preferences, and engagement patterns to recommend content. Personalization helps users find relevant shows and films faster.
The business value is clear. Better recommendations increase engagement. Higher engagement can support retention. It also helps Netflix make better decisions about content investment and promotion.
■ Amazon: Inventory and Product Recommendations
Amazon uses data to recommend products, forecast demand, position inventory, and improve delivery operations. Customer browsing behavior, purchase history, product relationships, and local demand patterns all contribute to its decisions.
The lesson for other businesses is not to copy Amazon’s scale. It is to use available customer and inventory data to improve relevance, availability, and delivery performance.
■ Starbucks: Location and Customer Insight
Starbucks uses location data, demographics, local demand patterns, and customer behavior to guide store strategy. This helps the company evaluate potential sites and understand how local market conditions affect performance.
For growing businesses, location intelligence can support decisions about branches, distribution points, service areas, or local promotions.
■ Zara: Faster Supply Chain Response
Zara is known for using store-level sales feedback and inventory information to respond quickly to demand. Its model supports smaller production runs and more frequent updates to product assortments.
This reduces the risk of producing large volumes of products that do not sell. It also allows the business to respond faster to changing customer preferences.
■ Google: People Analytics
Google’s Project Oxygen used data to study management effectiveness. The initiative identified behaviors associated with stronger managers, including coaching, communication, and support for employee development.
The point is not that every company needs a large people analytics program. The point is that even leadership and HR decisions can improve when businesses use structured evidence.
■ Walmart: Inventory Planning
Walmart uses forecasting and supply chain data to manage inventory across stores and distribution centers. Seasonal demand, weather patterns, local events, and past sales all influence planning.
For retailers and distributors, this shows the value of connecting sales data with inventory planning. The right product needs to be available in the right location at the right time.
How Zylo Can Help in Data-Driven Decision Making
The Importance of Data-Driven Decision-Making is clear, but turning scattered business information into reliable action requires the right foundation. Zylo helps businesses connect data, reporting, analytics, and operational systems in a practical way.
From data consultancy and Business Intelligence to big data analytics and Odoo ERP implementation, the focus is on helping your team use information with greater confidence.
Whether you need a BI dashboard for executive visibility, real-time sales analytics for faster revenue decisions, or a structured data analytics solution for long-term growth, Zylo can help you move from disconnected data to usable insight.
Ready to make smarter business decisions with your data? Contact Zylo to discuss your goals and identify the right starting point for your organization.
Final Thoughts
The importance of data-driven decision-making is no longer limited to large global companies. Businesses of every size can use data to improve revenue, efficiency, customer experience, and resilience.
Start with one important decision. Choose a clear business question. Bring together the relevant data. Measure the outcome. Build from there.
You do not need perfect data to begin. You need a practical approach, reliable priorities, and a commitment to learn from evidence. Over time, better decisions become part of how the business operates.